The Week the Market Healed in the Dark
The headlines said tech was falling apart. Underneath, almost everything else was quietly getting better — and Friday set a record nobody noticed.


The most-watched stocks in the world had an ugly week. And the share of stocks holding above institutional positioning went up every single day.

Both of those things are true. Sit with how strange that is for a second, because the whole week lives in the gap between them.
The week had a shape, and the shape was a staircase
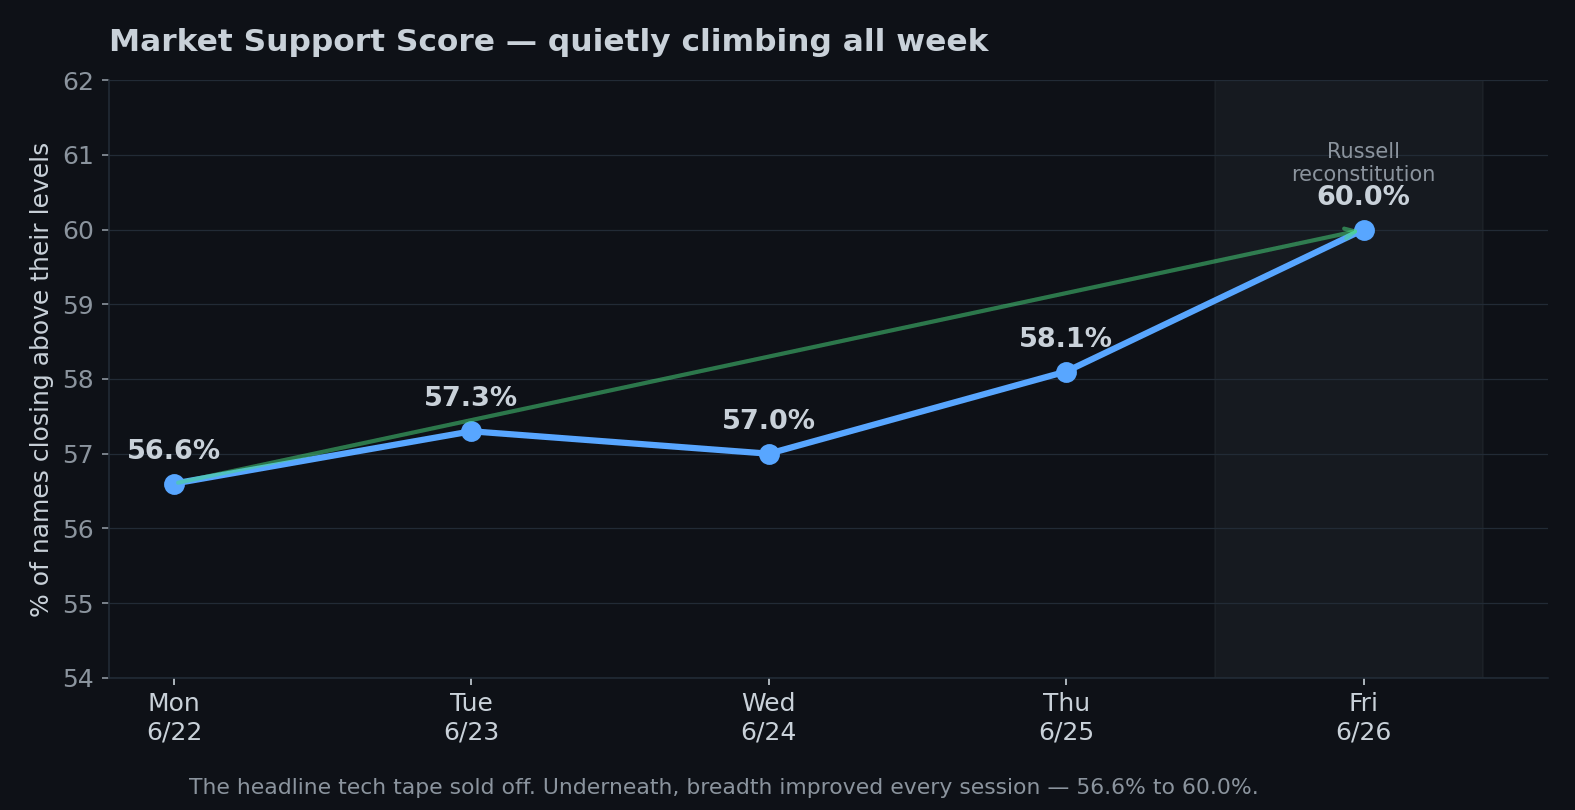
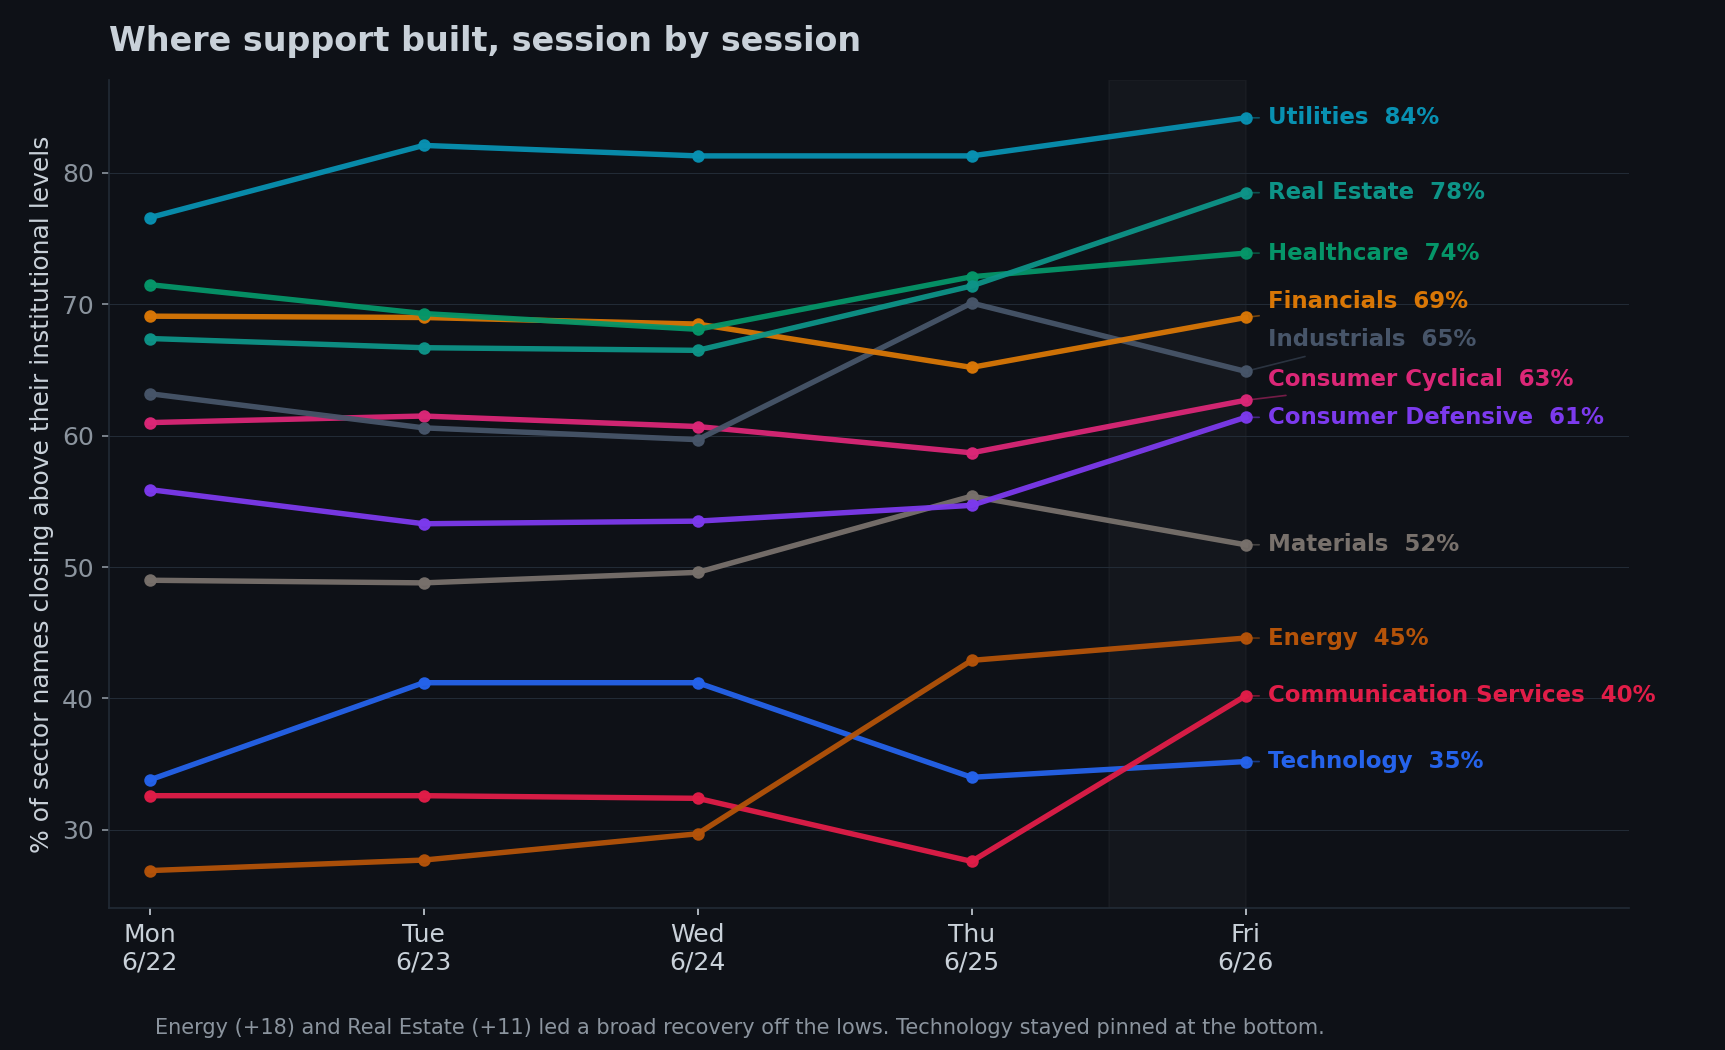
Here’s my support data — the share of stocks trading above the prices institutions actually care about - theirs! It read 56.6% Monday and climbed, almost every session, to 60.0% by Friday’s close. Last week this same number fell off a Wednesday cliff. This week it walked up a staircase.
Now hold that against the headlines, because they were describing a different market entirely. The Nasdaq fell 4.5%. The Magnificent Seven — the handful of megacaps the entire index leans on — dropped 5.5% as a group. The SpaceX shares everyone was euphoric about a month ago are now down 25% from their peak. If you only watched the marquee names, it looked like the air was coming out of the thing that has carried this market all year. And underneath those names, breadth was actually improving the entire time. That’s not a market falling apart. That’s a market quietly trading one leadership group for another — selling the thing everyone’s looking at, buying the thousand things they aren’t.

What put the staircase there
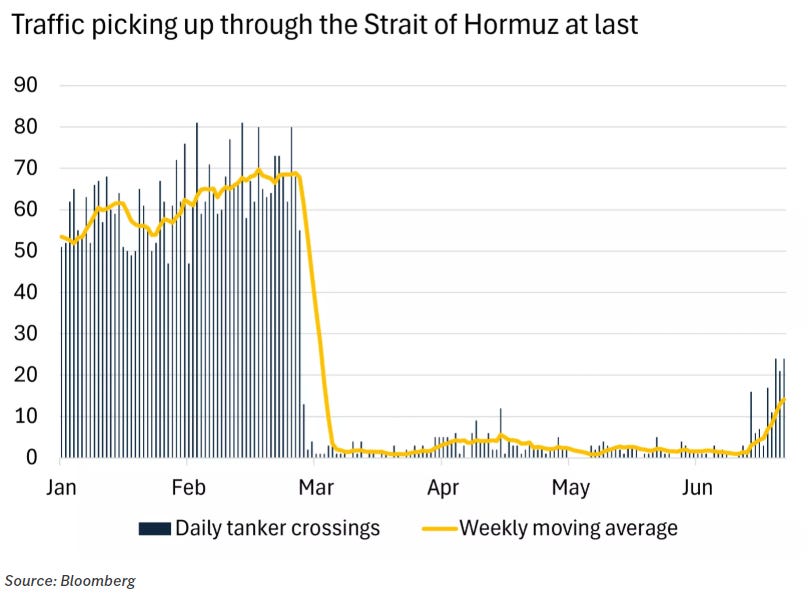
So what does the money know that the headlines didn’t lead with? Oil collapsed. The US–Iran peace deal held, tankers started moving through the Strait of Hormuz again, and crude fell below $70 — down something like $25 in a month.
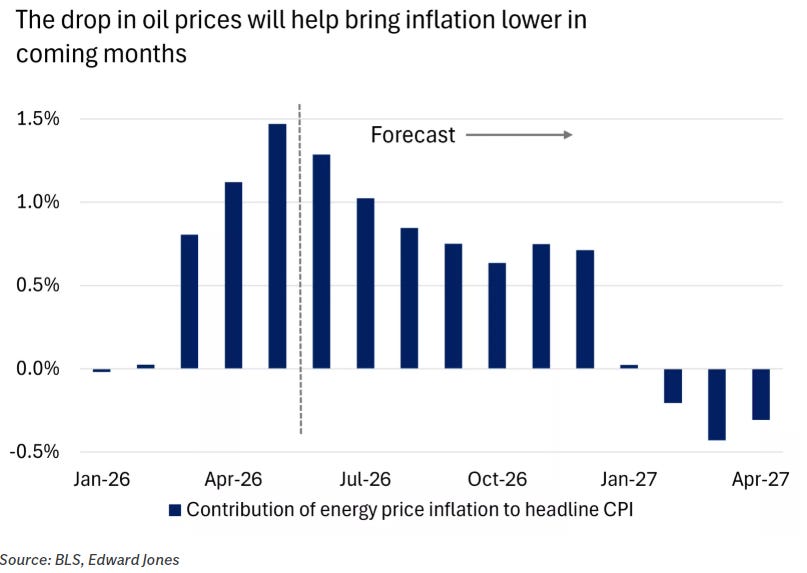
That matters more than it sounds, because energy prices had been the single biggest thing driving inflation higher all year. With oil falling, some strategists now think the inflation peak is behind us, with a “disinflation breeze” blowing through the summer. Cooler inflation means less pressure on the Fed to hike. Less pressure to hike means the rate-sensitive stuff that got crushed last week suddenly has room to breathe.
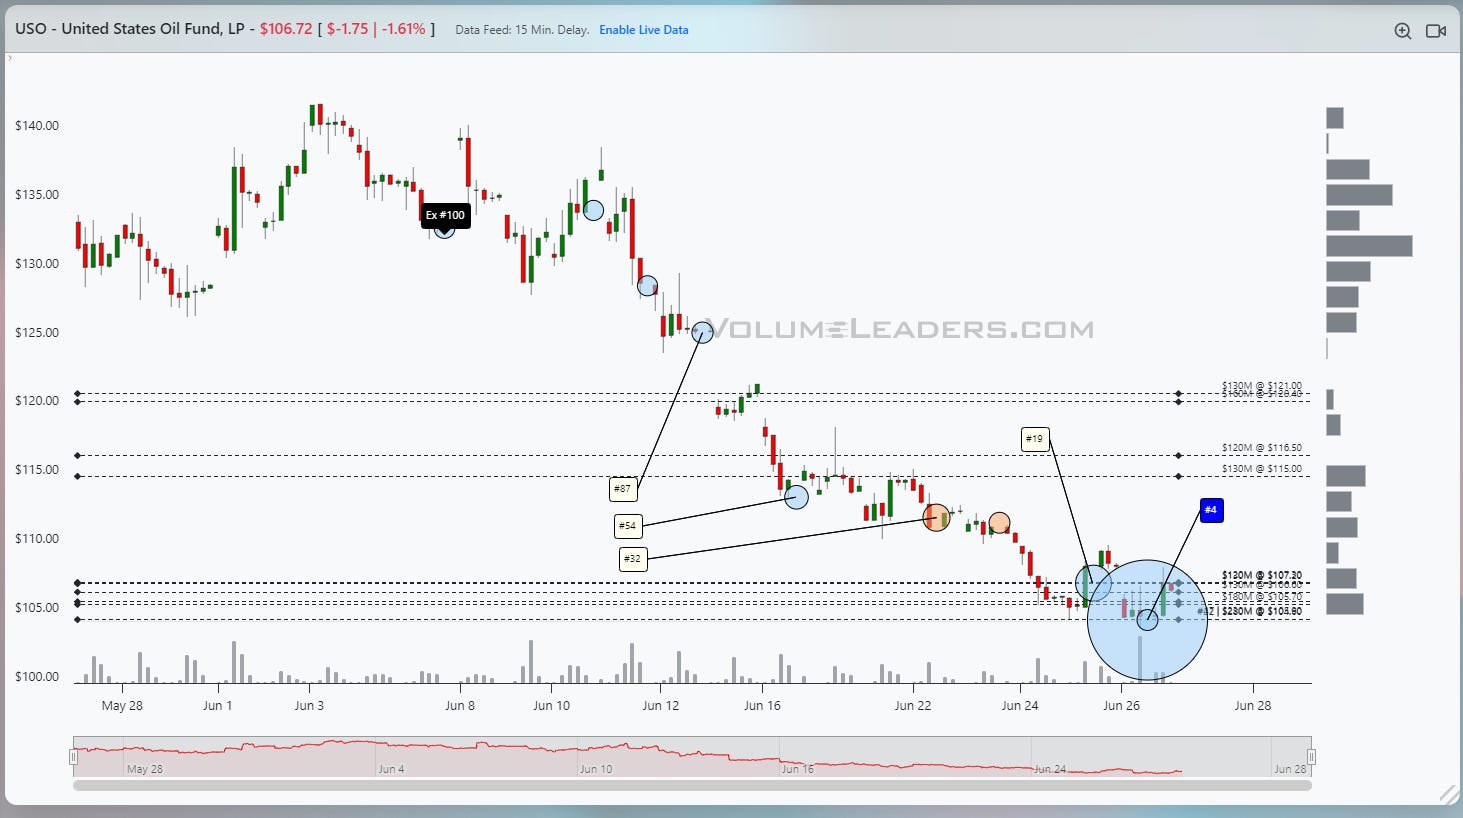
How will I know if said disinflationary breeze will bring cool winds and comfort over many hot summer days to come? I’m glad you asked, because among many ranked prints hitting the tape at the close today, a #4-ranked USO was gifted. Taken with the cluster of levels in the $105 region, we have a clear idea of current positioning and whether lower oil is inbound:
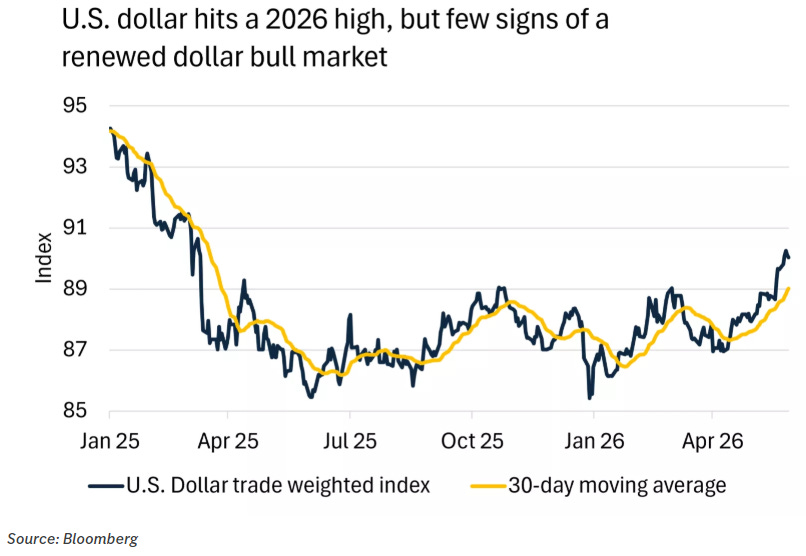
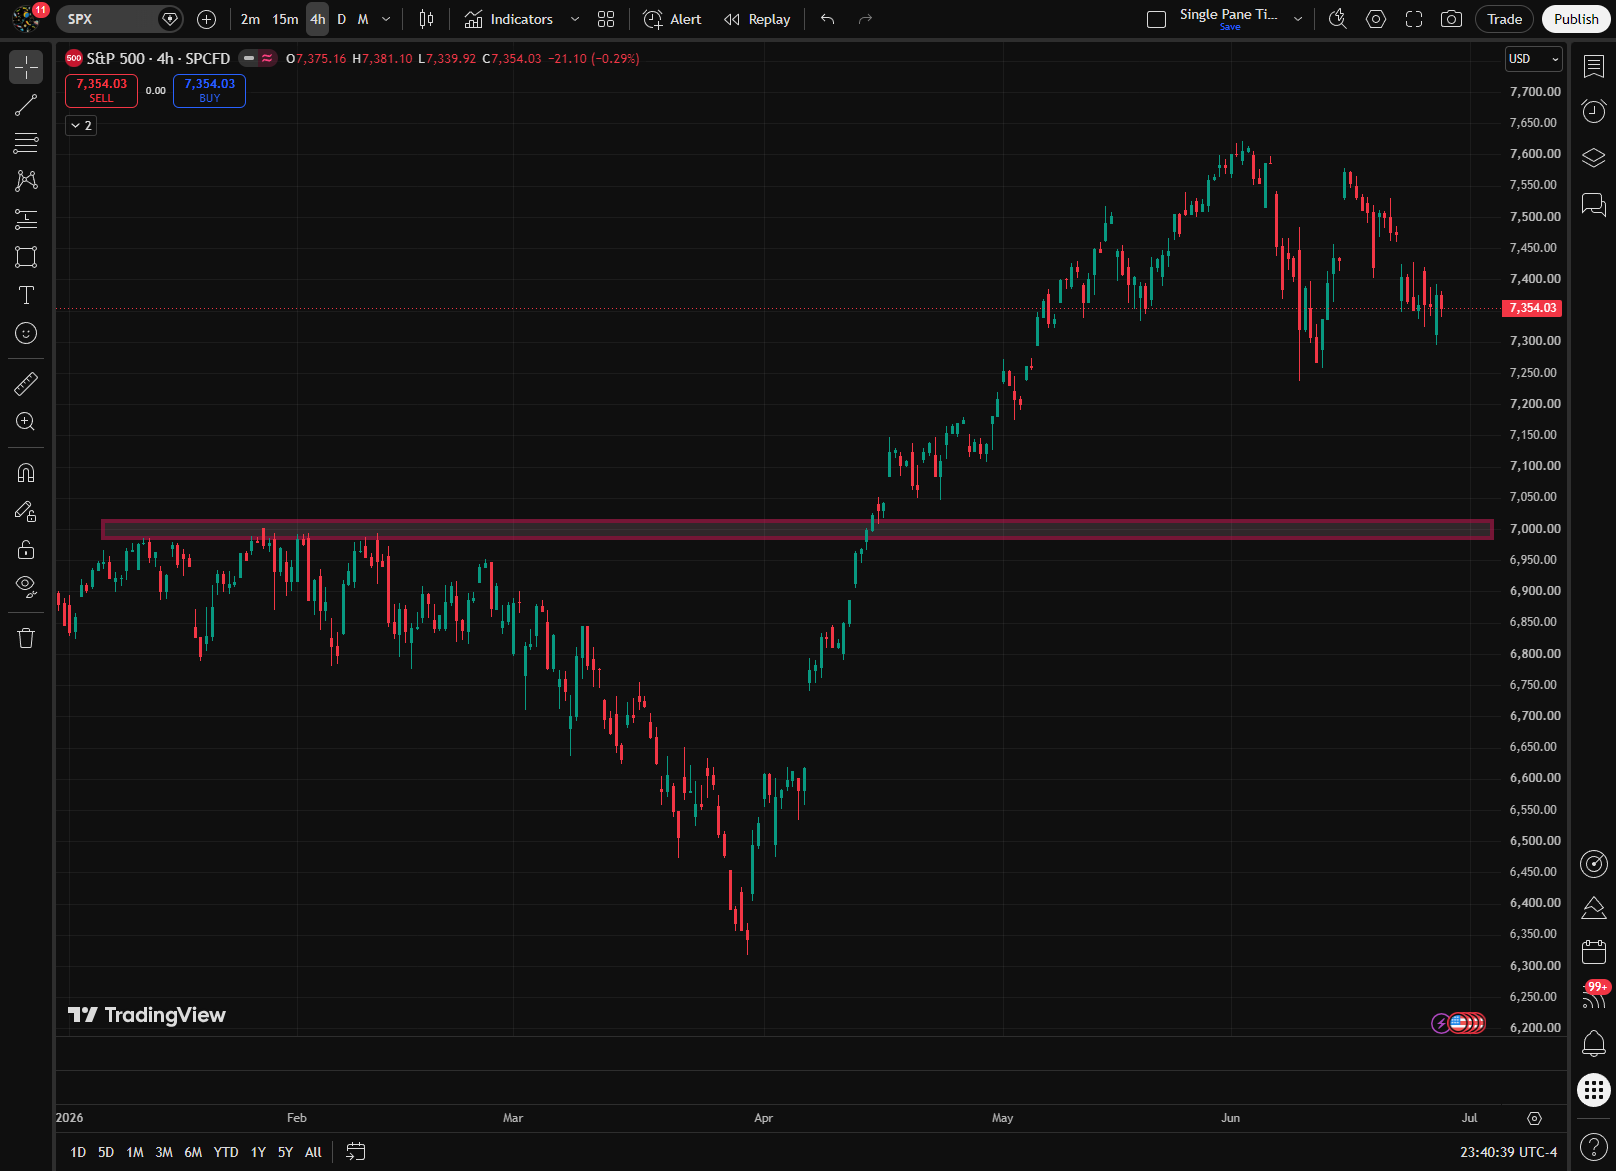
Not everyone’s convinced. The seasonal crowd will tell you June is historically a digestion month, that the S&P is carving lower highs and lower lows, that the dollar just broke out to a 2026 high, and that there’s still a path back toward 7,000 if support gives way. That’s the honest bear case, and I’m not going to pretend it’s impossible. It’s nice. It’s tidy. It’s a forecast about where price might go.
What I have is a record of where the money actually went — and last week the Fed turned hawkish, yields jumped, and these same rate-sensitive corners got taken to the woodshed. This week the tape ran the whole thing in reverse.
The market healed exactly where it hurt last week
This is the part that made me sit up, because it’s a near-perfect mirror image.
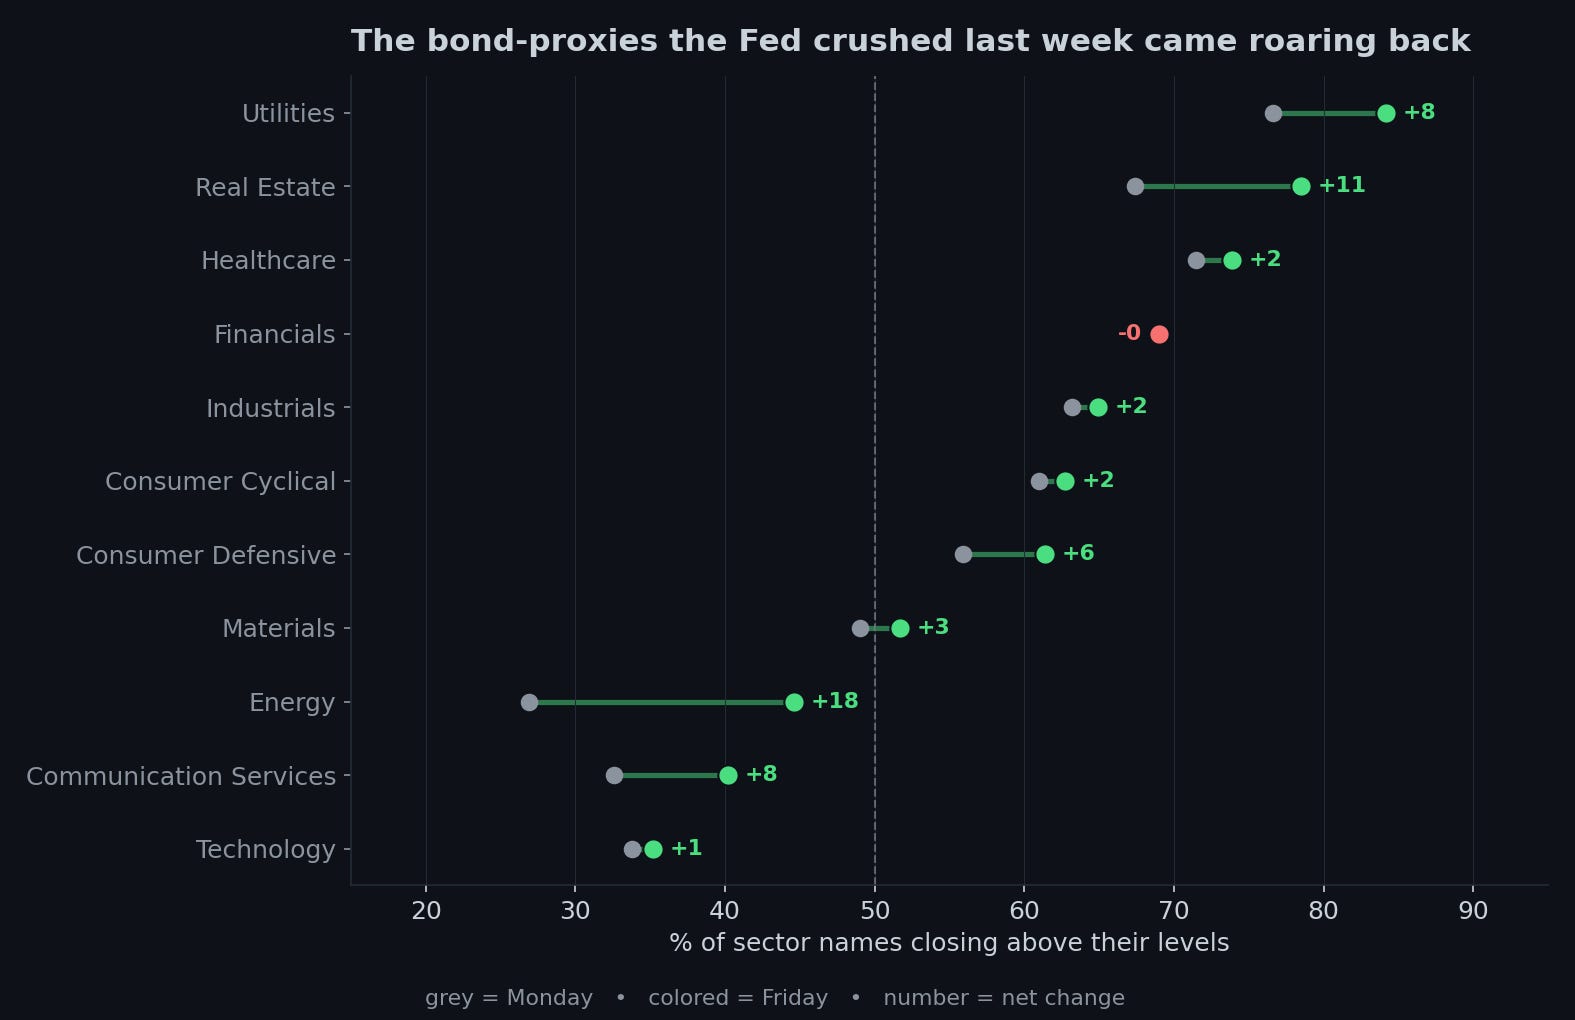
Every sector but one gained ground this week, and the biggest gainers were precisely the names the Fed had clobbered seven days earlier. Real Estate jumped 11 points. Utilities — already the strongest sector on the board — tacked on another 8. Energy surged 18, the single biggest move on the board, clawing up off the floor. The rate-sensitive bond-proxies that broke when yields spiked last week reversed hard the moment falling oil took the next rate hike off the table. The mechanism is almost mechanical: oil down → inflation fear down → rate-hike odds down → the stuff that hates high rates rips.
And the one sector that didn’t really participate? Technology — stuck at the bottom, barely a point higher on the week, exactly where the headlines said it would be. So the scary story wasn’t wrong. It was just small. Tech sold off, and almost everything else healed around it. That’s the “broadening” the strategists keep describing, except with VL data you can see it happening at the level of individual stocks instead of taking their word for it.
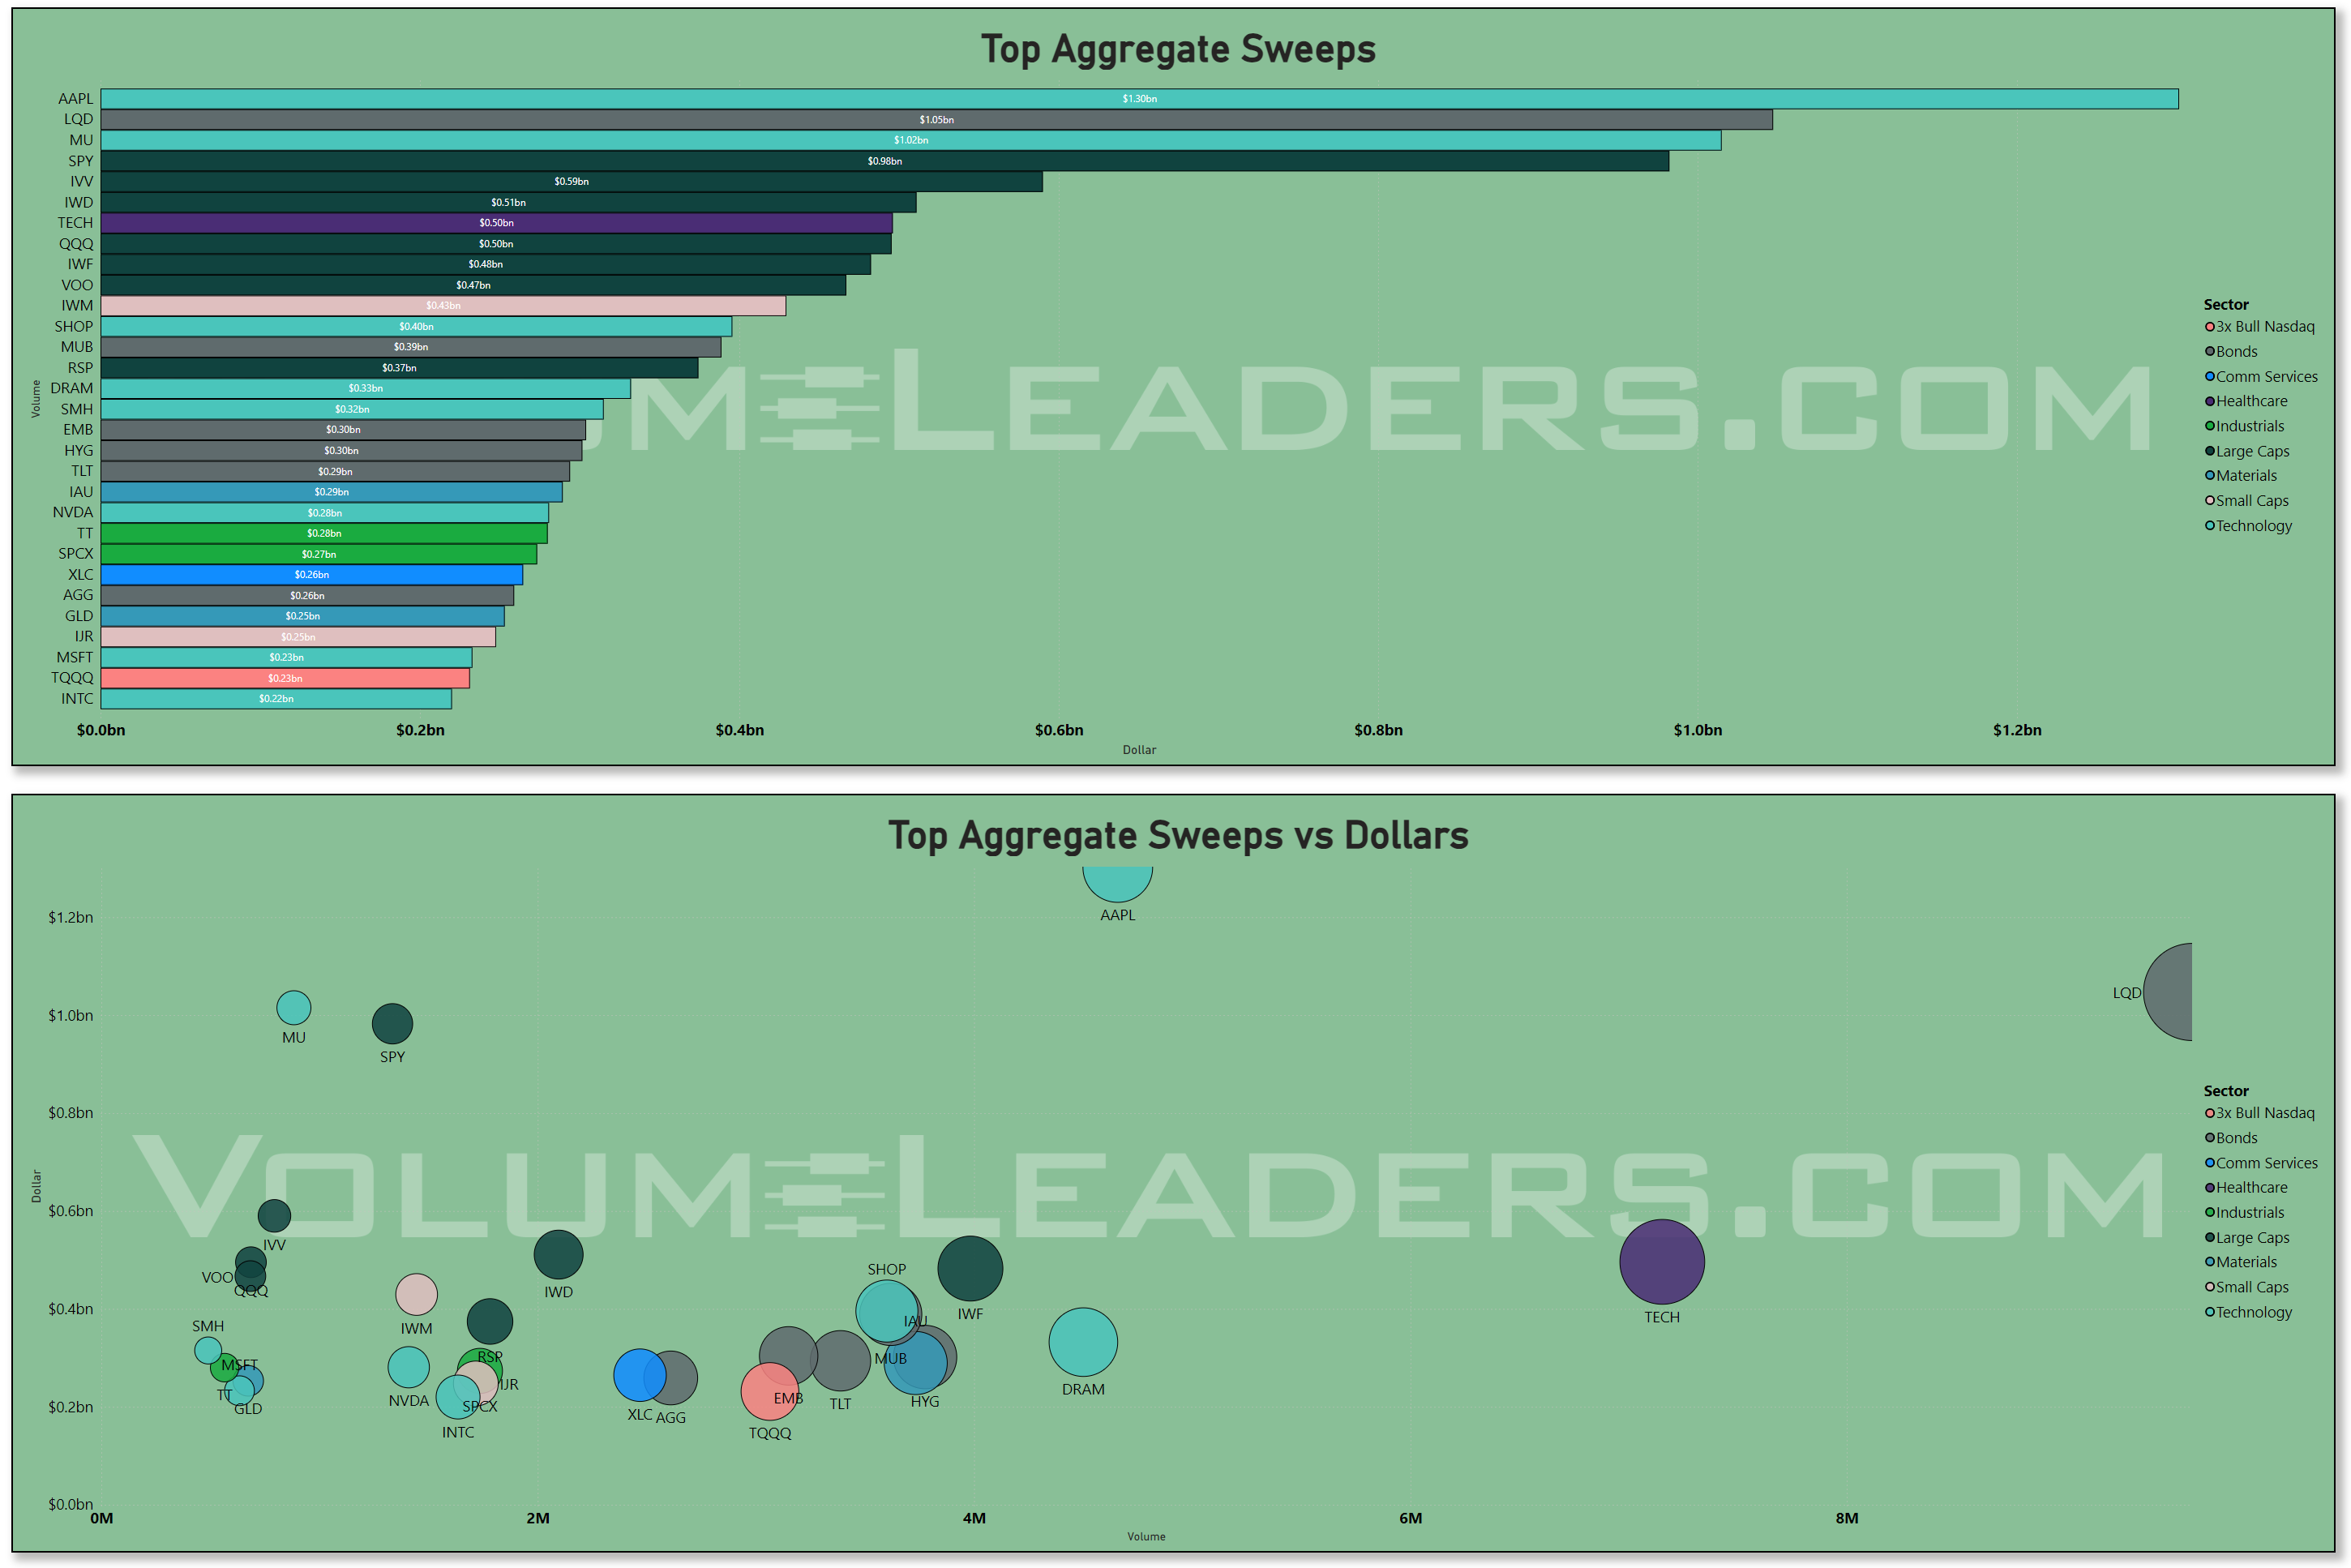
You can confirm it isn’t a directional bet by where the aggressive money went. The week’s hardest, most impatient buying — the sweeps — didn’t chase the megacaps. It hit value (the IWD value ETF), small caps (IWM), the equal-weight S&P (RSP), and a wall of bonds: investment-grade credit, munis, long Treasuries, high yield. That’s not a tech trade or even a stock-picking trade. That’s money voting, with urgency, for everything except the cap-weighted index everyone’s worried about.
And this didn’t start this week. Look back at the Fed week — the one that supposedly broke everything — and even then high-yield bonds quietly outperformed. Risk appetite never actually left; it just moved house, out of the famous names and into the broad market and the credit that pays you to wait. Falling oil didn’t start the rotation this week. It just turned a quiet drift into a stampede.
The trade hiding inside the tech sell-off
Now the wrinkle, because “tech sold off” is too blunt and the flow data won’t let me leave it there.
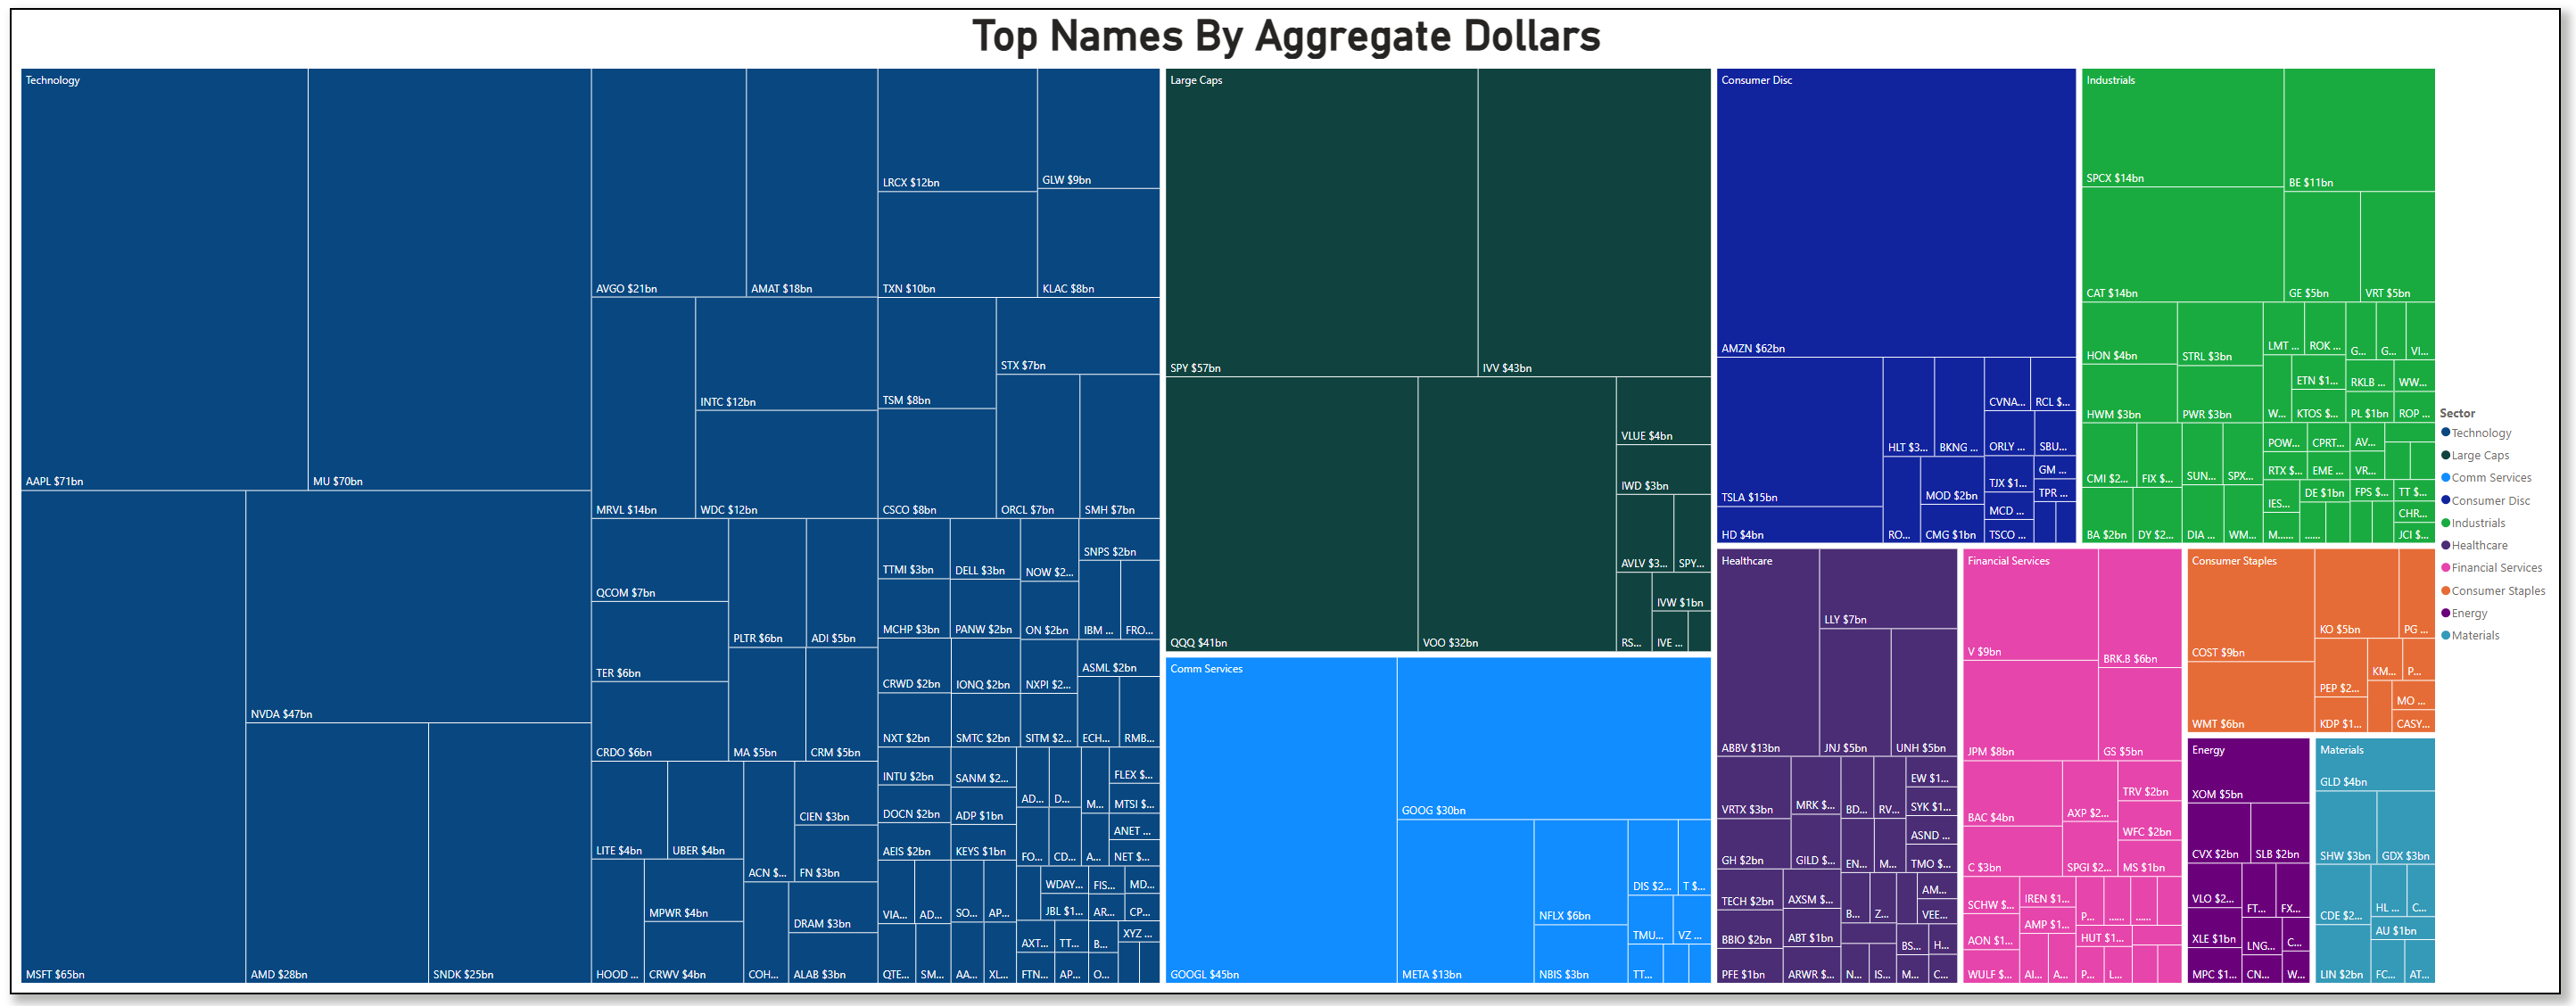
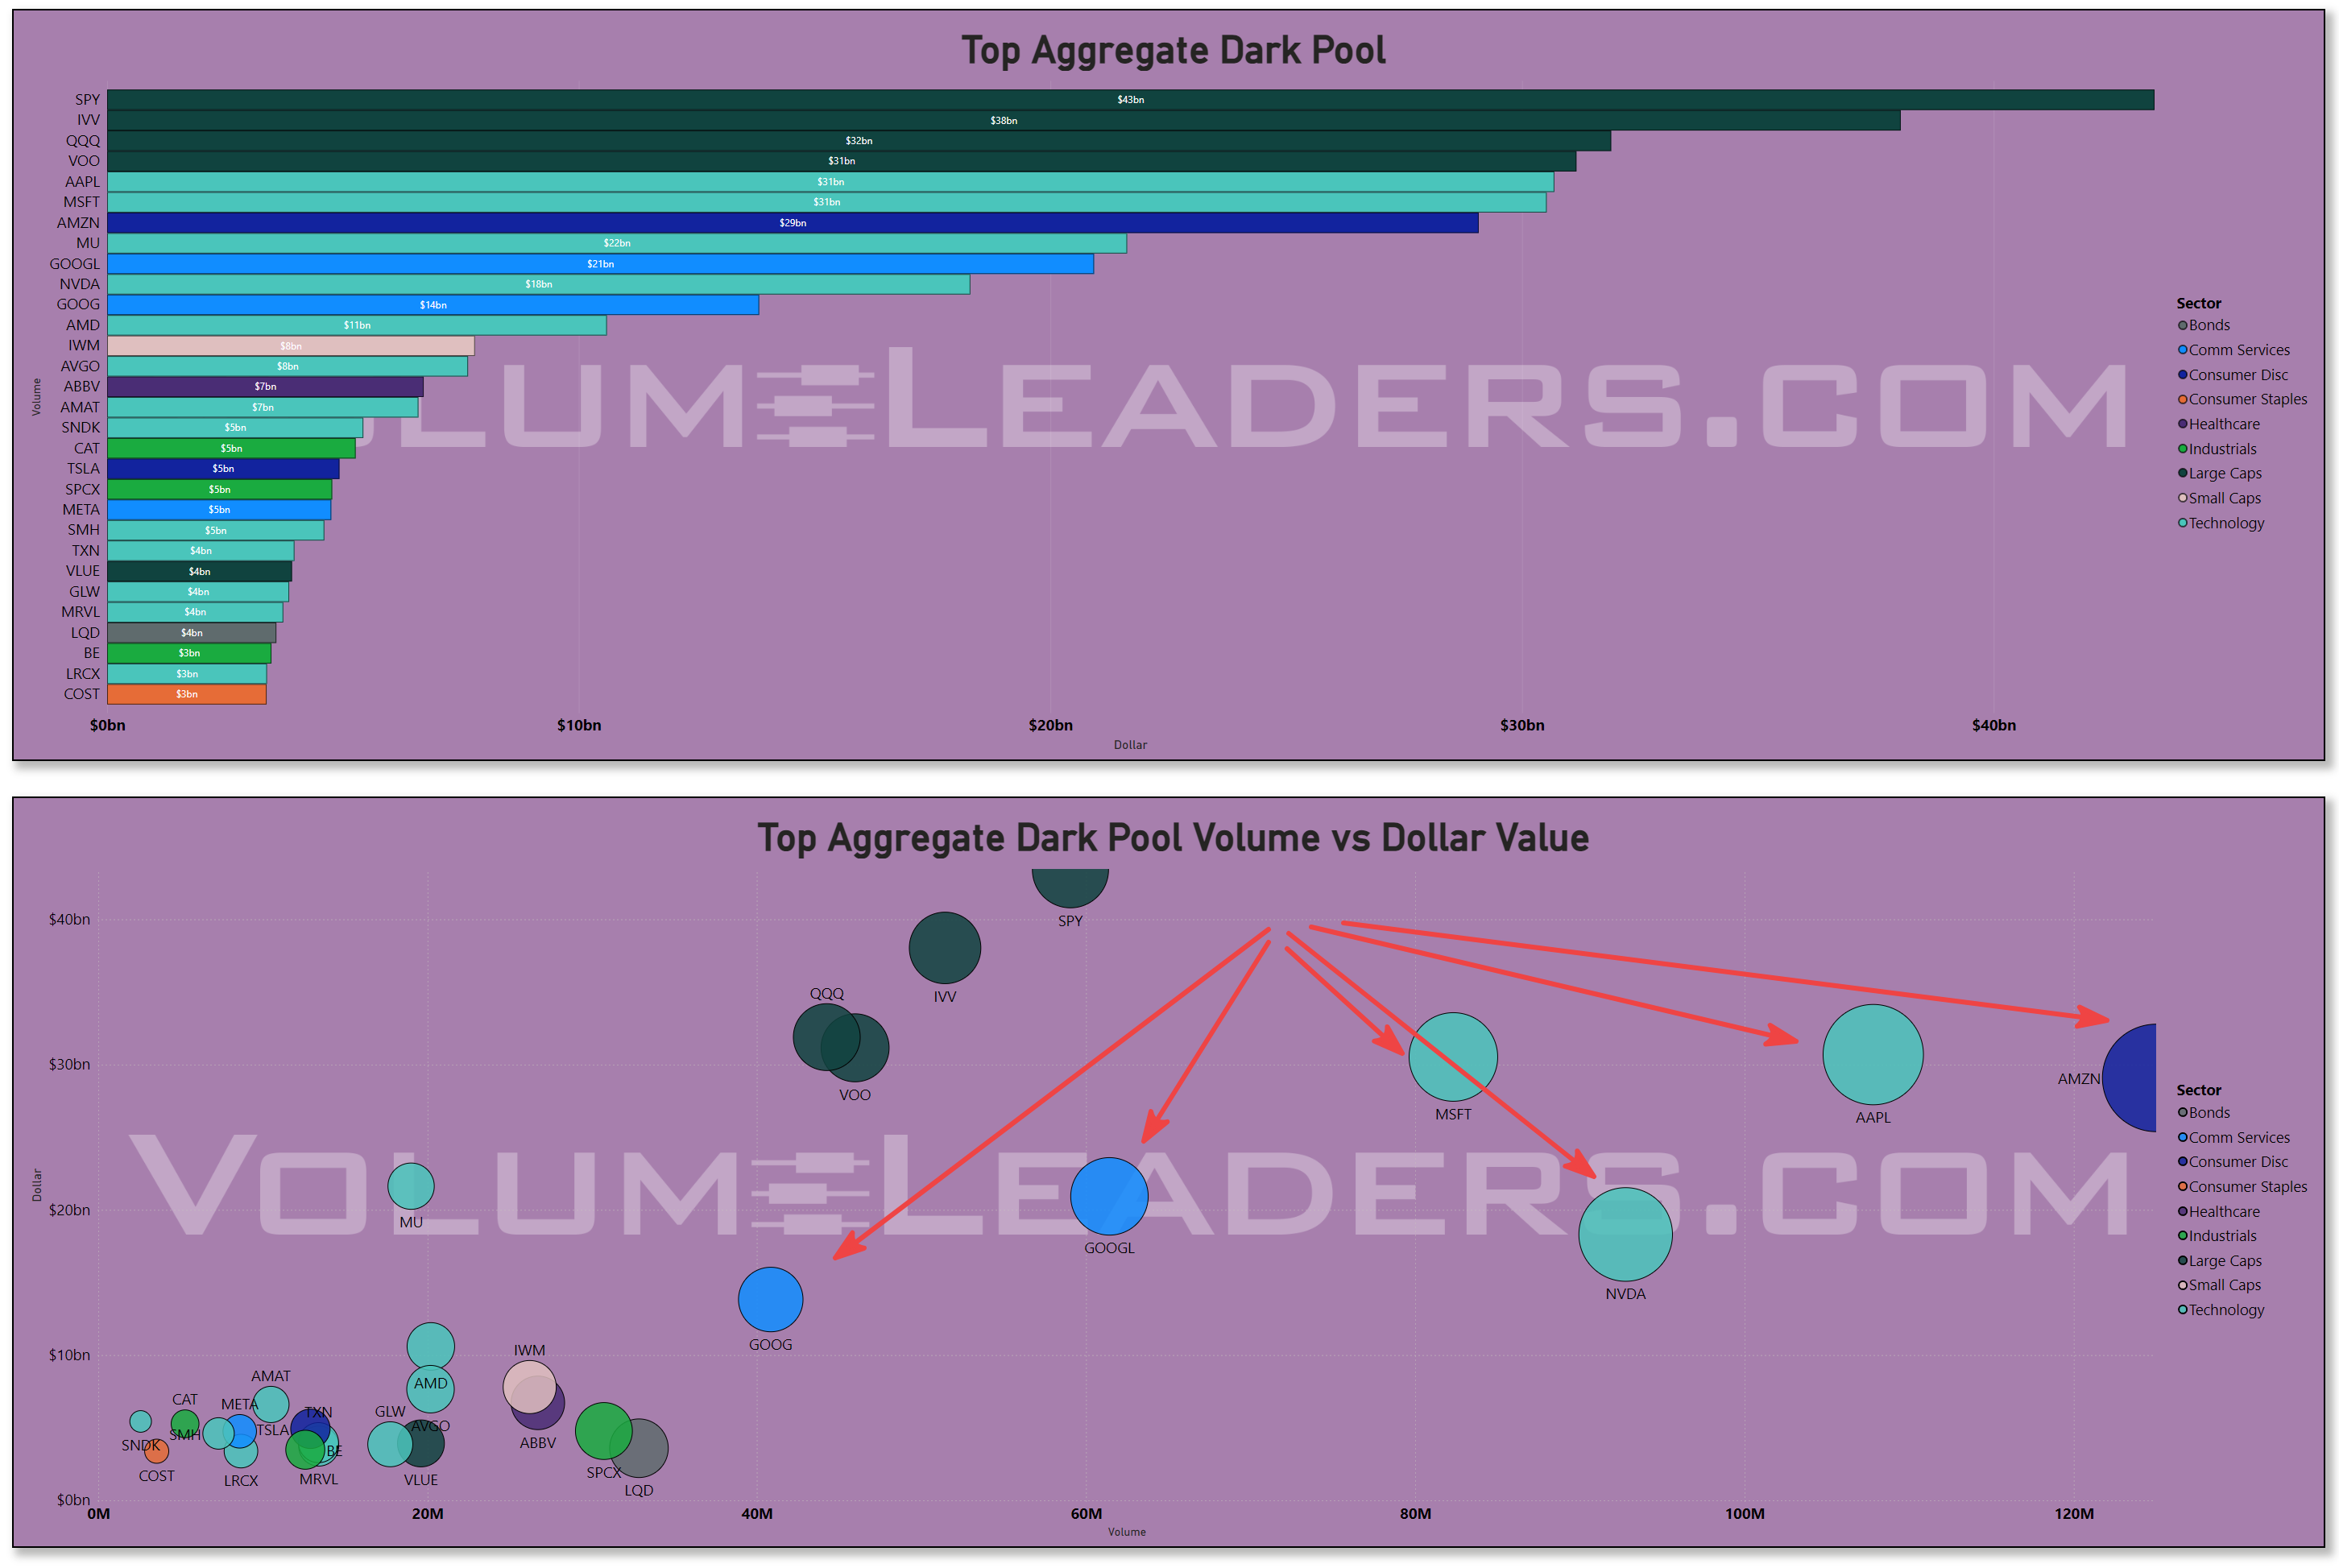
While the Magnificent Seven were dropping as a group, the memory and storage names were being traded in spades. Micron printed $70 billion in aggregate flow this week — second only to Apple, more than Nvidia, more than Microsoft...I don’t think I’ve ever seen that before. SanDisk, Western Digital, Marvell — the whole memory-and-storage complex lit up. And a small memory-linked ticker, DRAM, showed up in my statistical-outlier table on three separate days, repeatedly trading dozens of standard deviations above its own norm. So “tech” didn’t uniformly sell off. The crowded megacaps did. The memory cycle, underneath, was being traded hand over fist. Same sector, different appetite — and you’d never know it from a headline that treats “tech” as one thing.
And then the Russell rebalanced
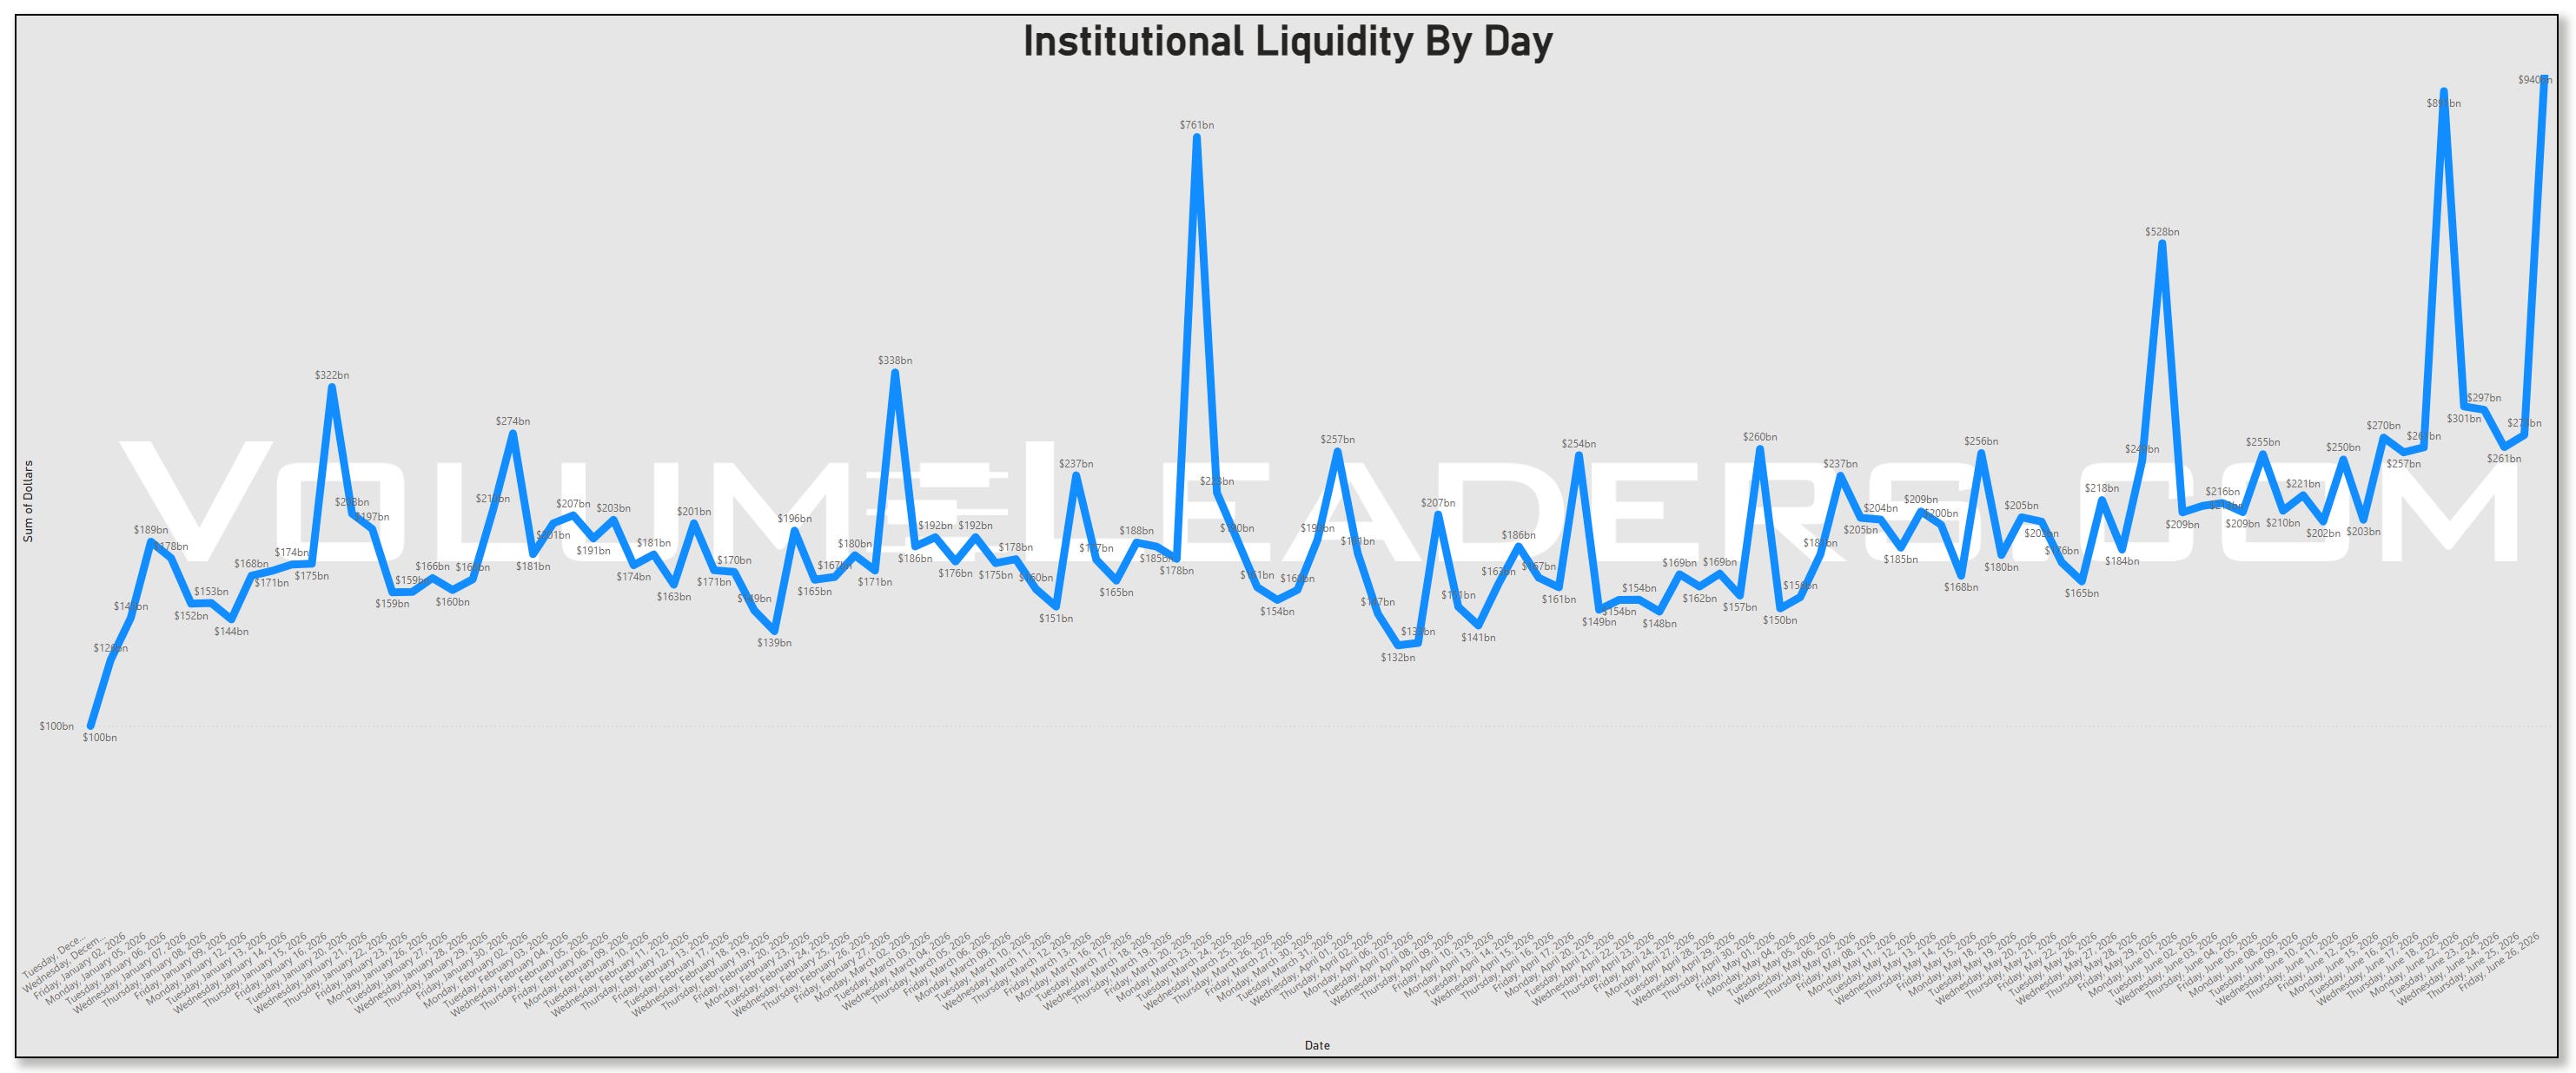
Then came Friday, and Friday was the largest day I have recorded…ever…yes, again.
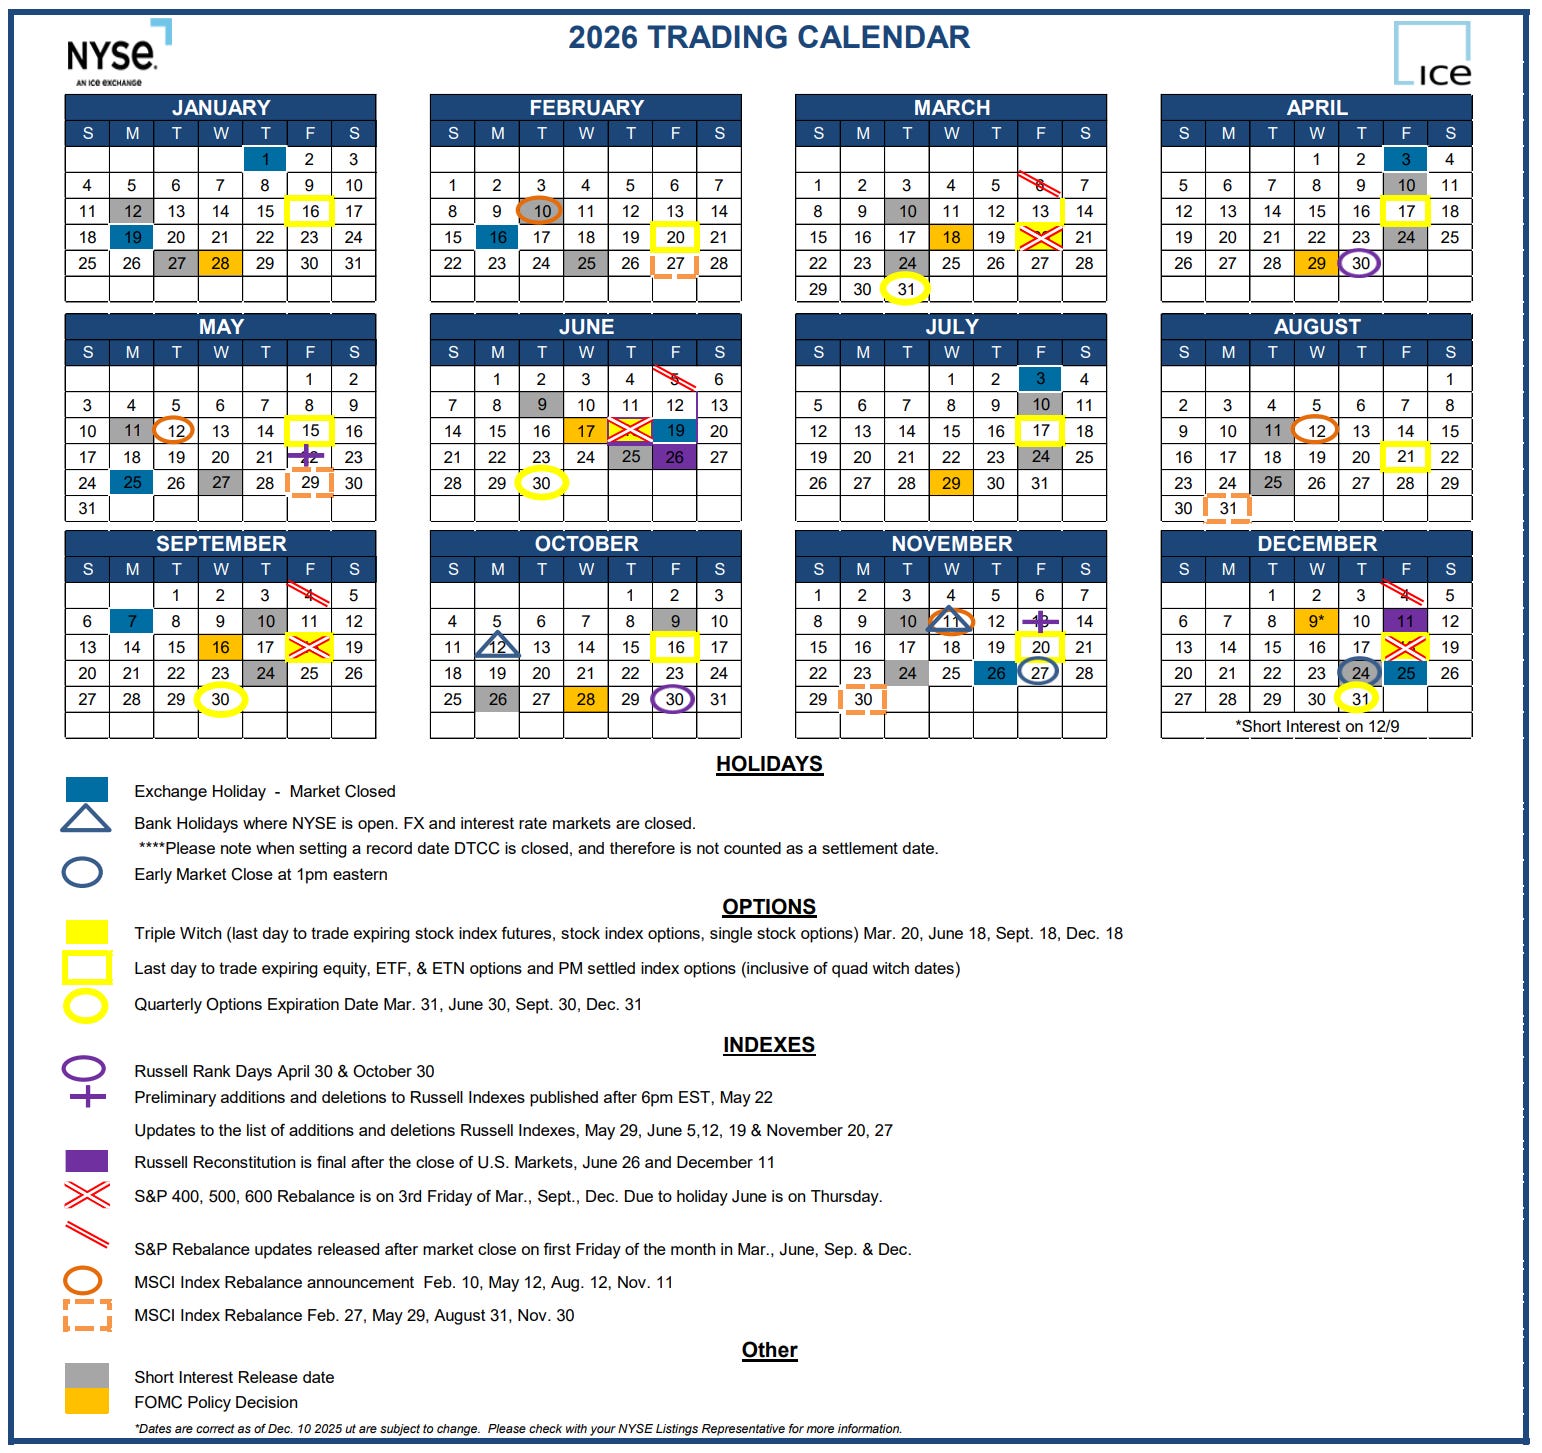
Most days this year, total institutional liquidity runs somewhere between $150 and $270 billion. Friday it hit roughly $940 billion — bigger than last week’s quad-witching, which itself was the previous record. The reason is the Russell reconstitution: twice a year, the Russell indexes redraw their membership entirely — which stocks count as small-cap, which graduate to large, which fall out — and every index fund on earth has to rebuild its holdings to match, all at once, mostly in the closing auction. The next one is in December:
Every one of the week’s most extreme prints landed on Friday: Amazon trading 110 standard deviations above its norm on a $21 billion print; and then a parade of small and mid-cap names you’ve probably never heard of — OFRM at 195 sigma, QTEC at 173, ISSC at 156, OPEN at 129 — putting up readings that are statistically almost impossible unless a wall of index money is being forced through them on the same afternoon. Which it was.
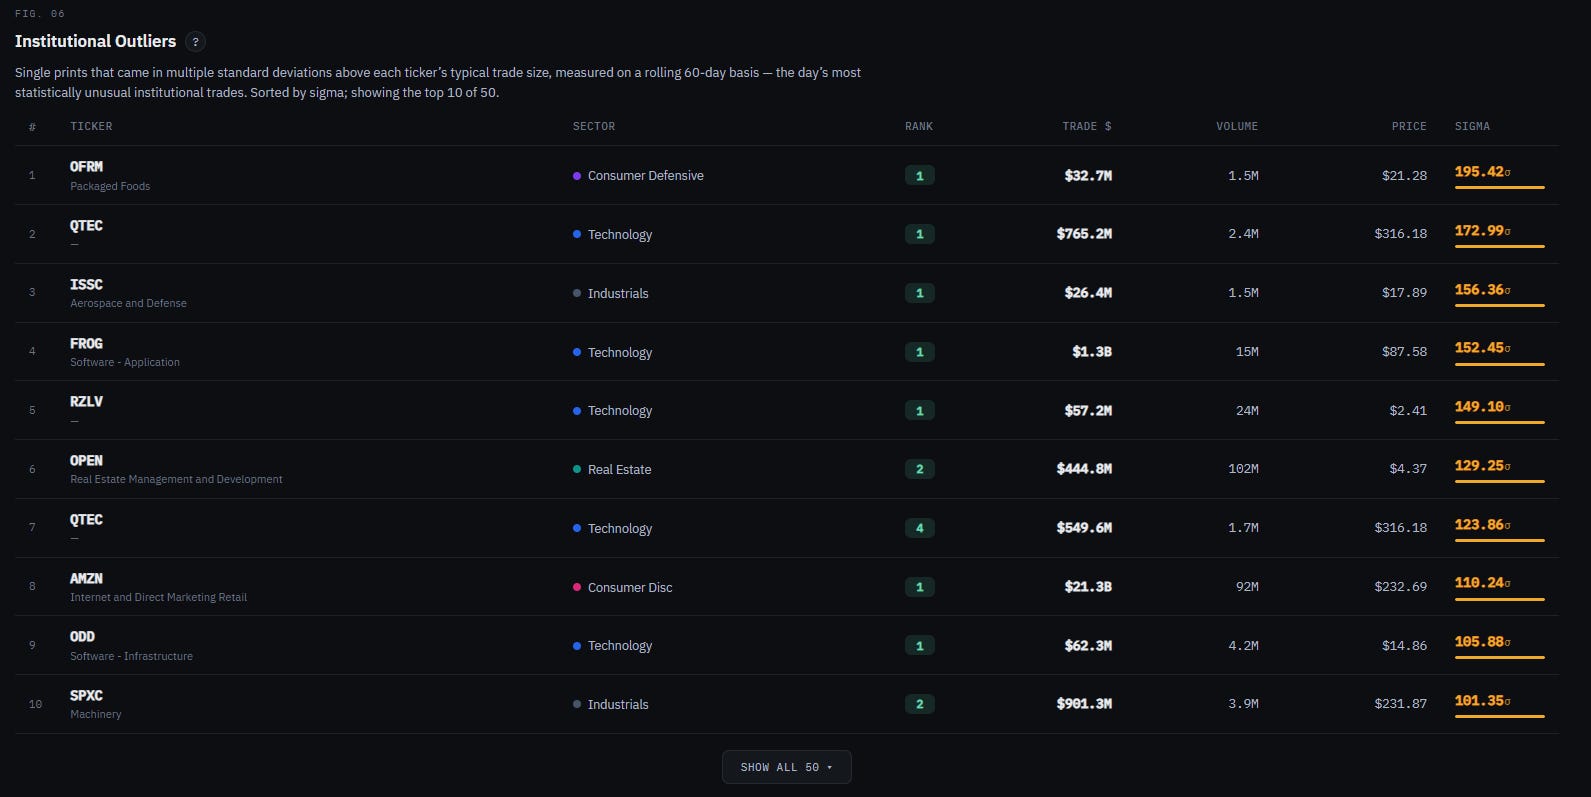
It’s worth pausing on what a number like 195 sigma actually means, because the brain slides right off it. A “normal” busy day for one of these little stocks is a person walking through a doorway. A three-sigma day is a rare event — a few times a year, a small crowd sprints through. A 195-sigma print is is like the wall coming down and a freight train going through where the doorway used to be. These are not readings that occur in nature; they only occur when the calendar forces them. And that $940 billion is the same story told at market scale: if an ordinary session is the daily traffic crossing a bridge, Friday was every car that will cross it for the next month trying to get over between 3:50 and 4:00 p.m.
And that’s the honest caveat, the same one I gave you for last week’s OpEx: a huge share of that $940 billion is mechanical, not conviction. It’s funds rebalancing because the rulebook says they must, not because anyone woke up Friday with a view. The trick is not to mistake the machine doing its annual housekeeping for a thousand fund managers making a statement. Some of it’s a statement. Most of it is the calendar.
But — and this is why it still matters — the organic part of the week, the steady Monday-through-Thursday climb in support before the Friday machine kicked in, was real. The broadening was already happening. Friday just stamped a record-sized exclamation point on a sentence the market had been writing all week.
Where I’m watching next week
The bond-proxies are the tell. Real Estate and Utilities just round-tripped a brutal Fed week in five sessions. If the prints keep accumulating there, the “oil-down, hikes-off” trade has legs. If the bid fades, it was a reflex bounce, not a real turn.
Energy is the genuine puzzle. Its support leapt 18 points — the biggest move on the board — while oil was falling. Those two things don’t usually go together, and I don’t have a clean answer. Either it’s beaten-down money rotating into the most hated sector on a mean-reversion bet, or it’s something I can’t see yet. If you have a thesis, let me know in the comments. Either way, here’s the tell that settles it: if Energy’s average sector support score (the dot) moves up and we get some tightening of the box (lower dispersion) and/or the USO print resolves bullishly, Energy may have some legs next week. On the other hand, if the average support score hovers under the midline and dispersion stays high and the USO print resolves bearishly, it was the Russell machine passing through, and it’ll fade by Wednesday.
The memory cycle. If Micron and the storage names keep drawing flow while the megacaps bleed, the “tech is dead” story is going to age badly — it’ll turn out the money just rotated within tech, from the crowded names to the cyclical ones. Even if they decide to cool off for a bit, look at how Mags lit up in the dark pools this week ahead of America’s birthday:
What this means for you, depending on your clock
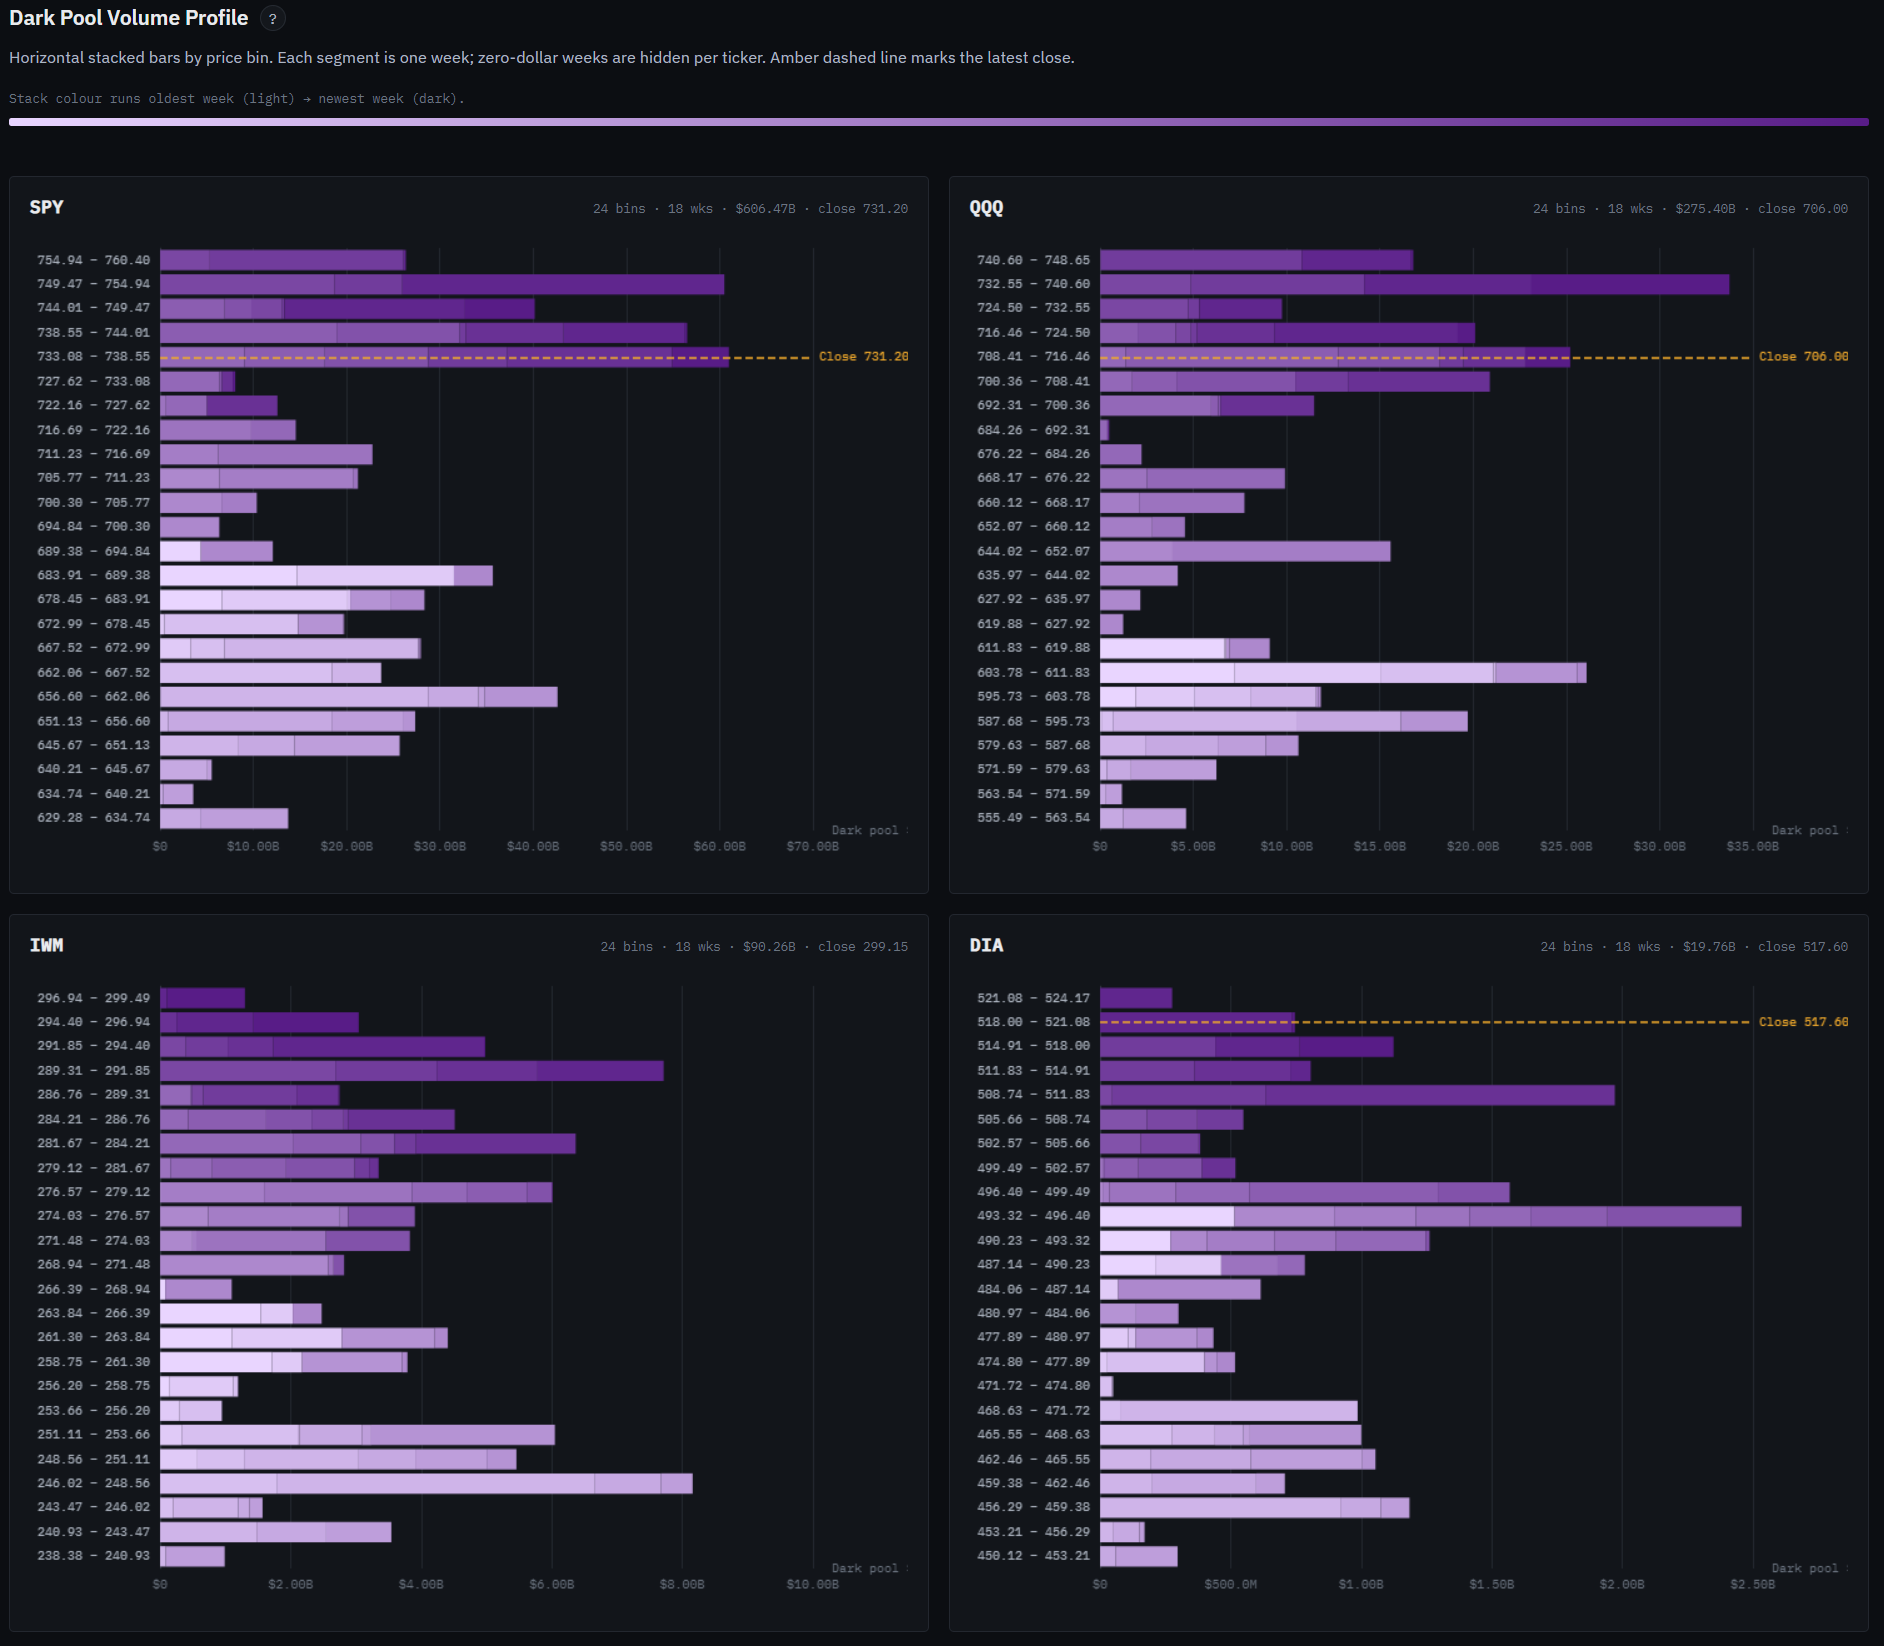
If you trade in days to weeks: the broadening is the trade, and it’s the same trade the aggressive money already put on — value, small caps, equal-weight, the rate-sensitive sectors, and away from the cap-weighted megacaps. You’d be trading with the tape and with a falling-oil tailwind. Just respect that June is seasonally a digestion month, and a strong dollar plus a wobbly S&P means this can still get messy. Let the prints at the levels, not the narrative, tell you when the broadening stalls. Use the institutional volume profiles to see where the largest players are concentrating their positioning in the major indices:
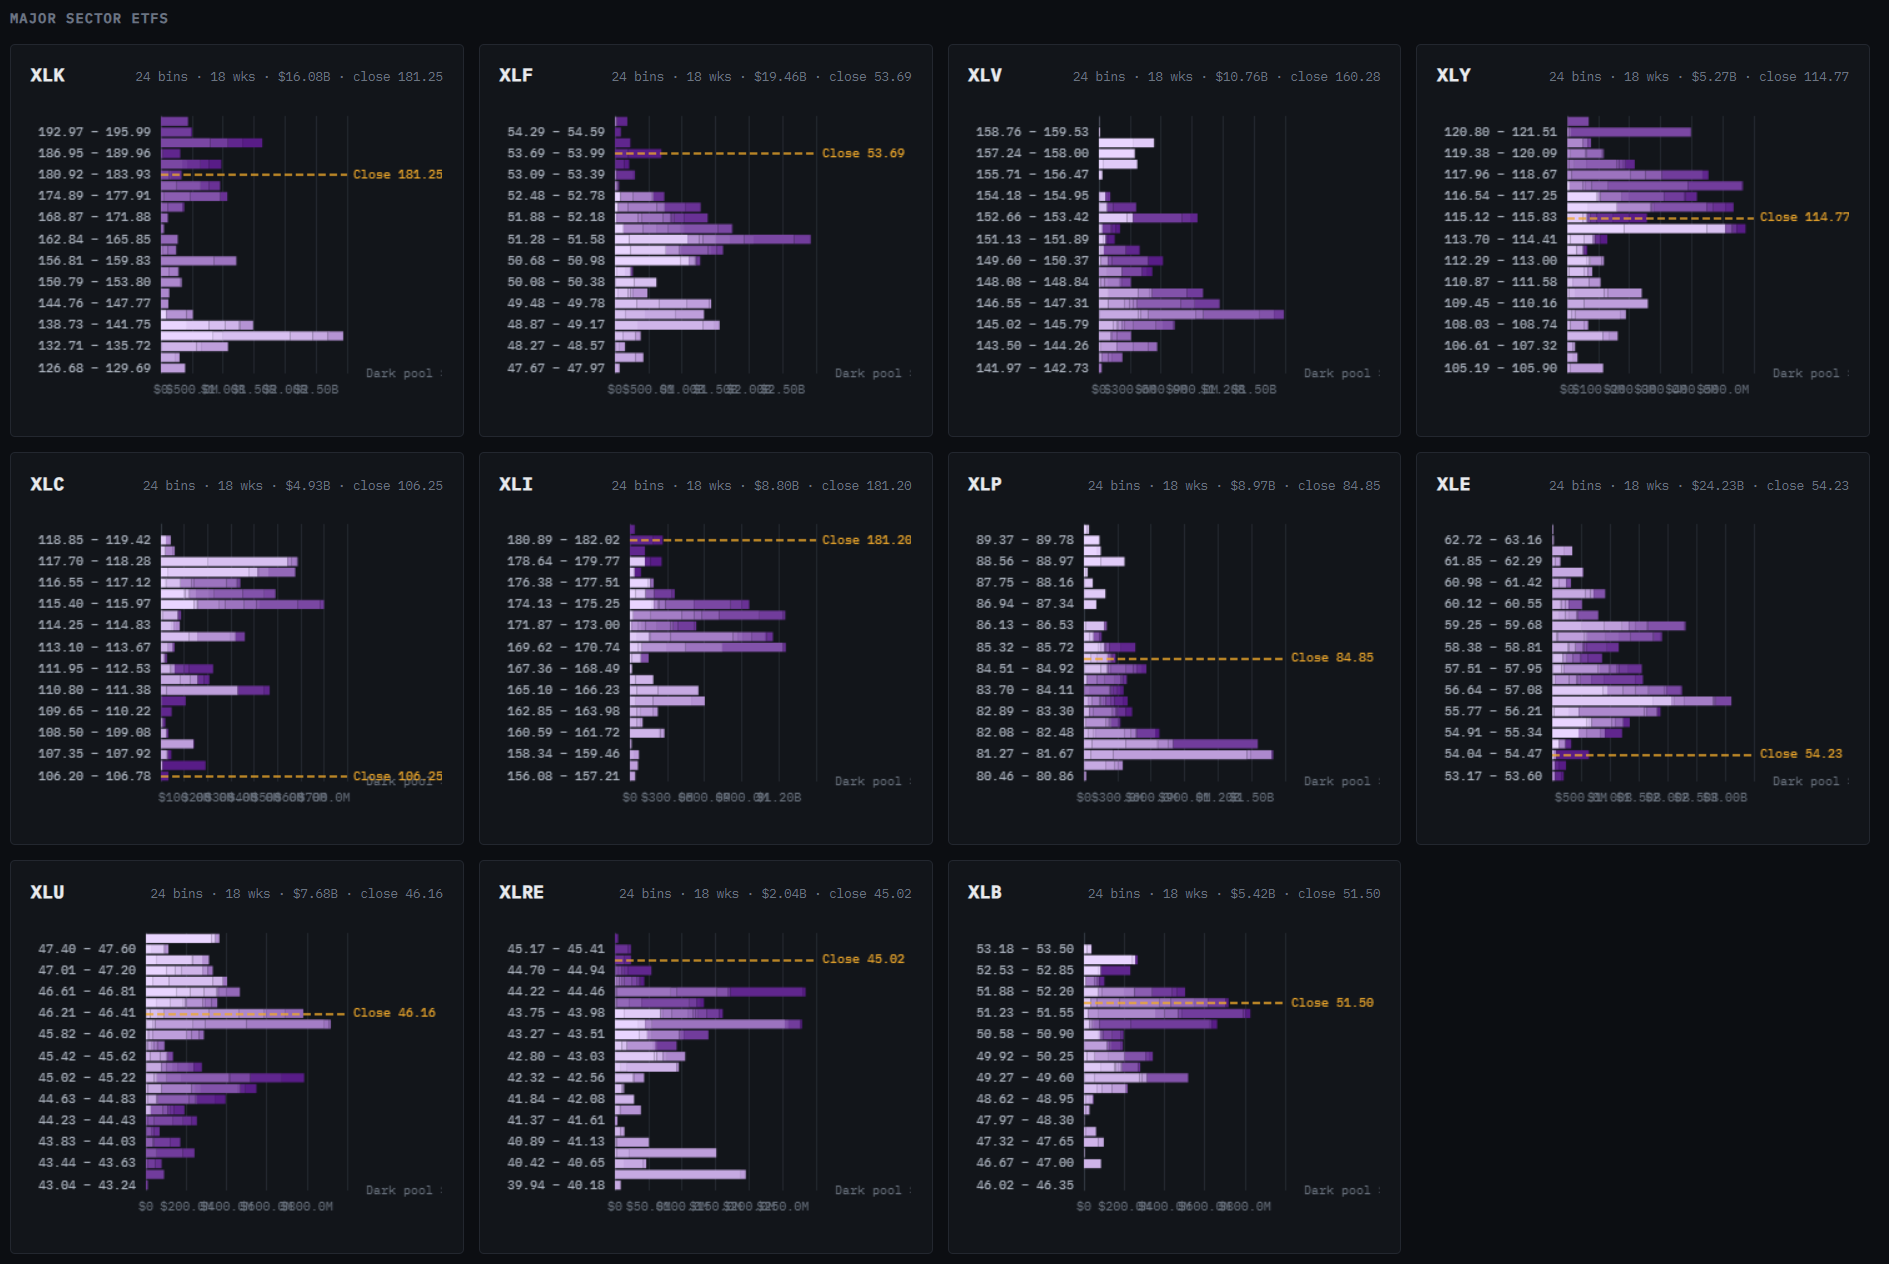
Here are the major sector ETFs:
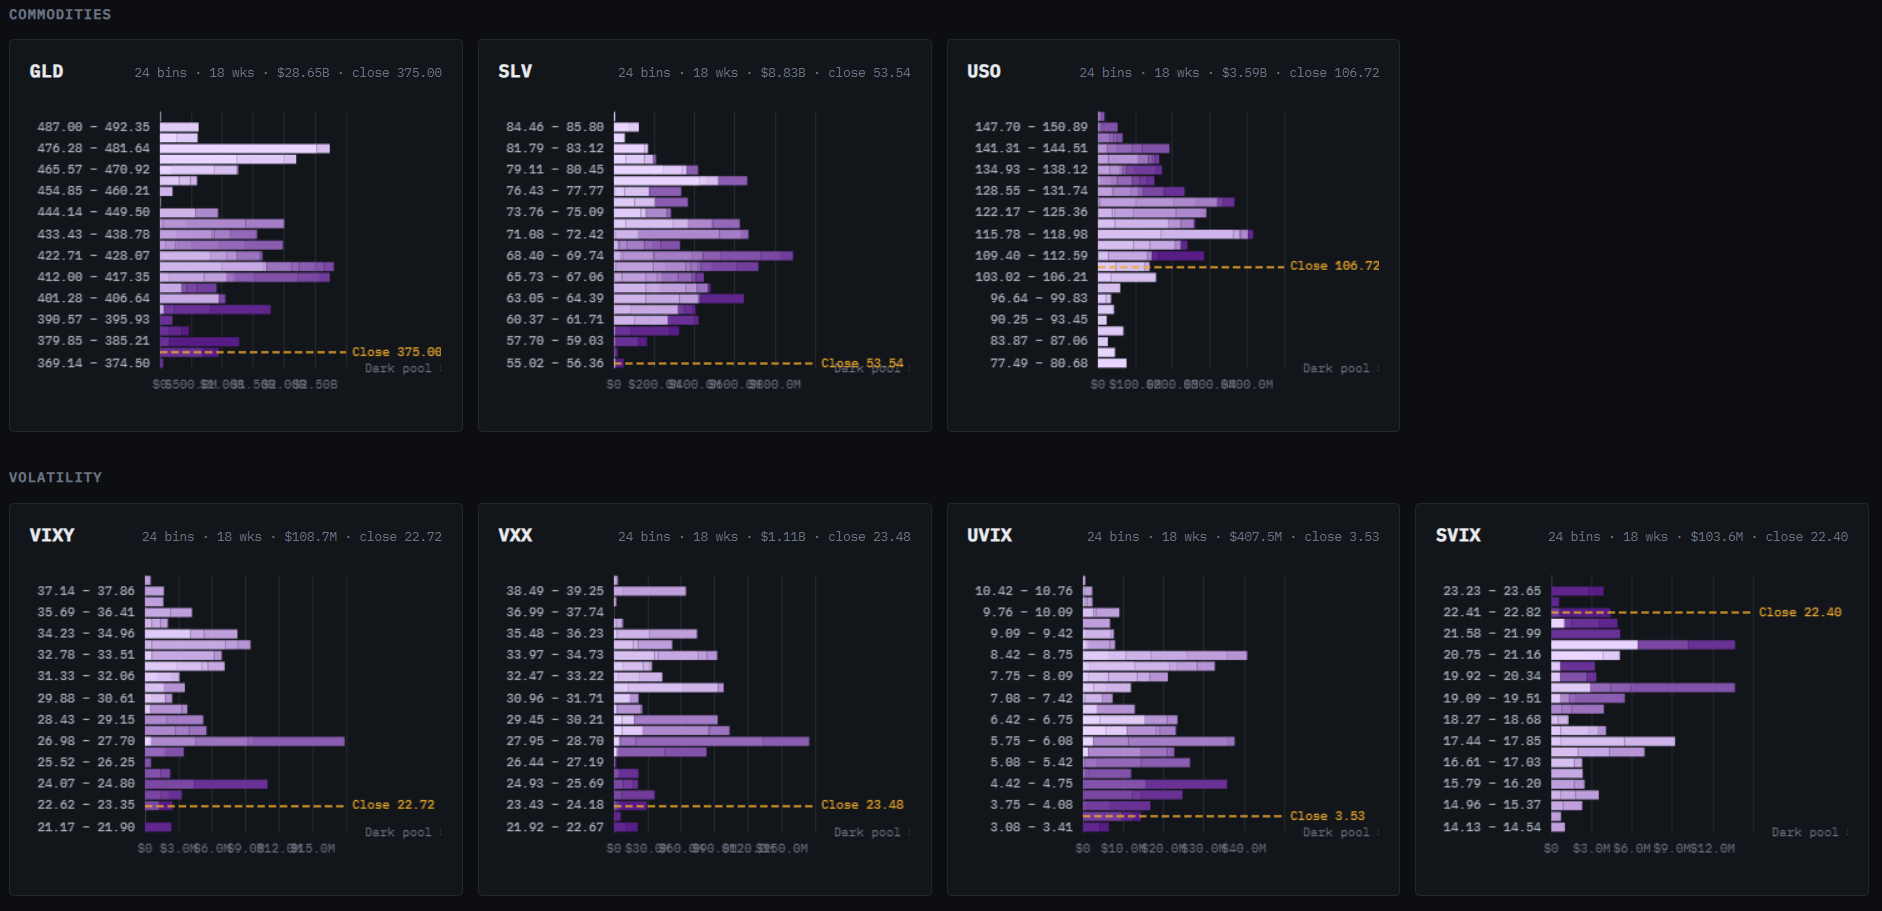
And some commodity and vol ETFs to round it out:
If you invest in months to years: this week is a small piece of evidence for something that’s been building all year — leadership widening out beyond a handful of megacaps. That’s healthy. A market where a thousand stocks are climbing is sturdier than one balanced on seven. It doesn’t mean abandon tech; it means a portfolio that owns only the famous names is narrower than the market itself has quietly become. The grown-up money spent this week diversifying away from the crowd. You’re allowed to notice.

And for everyone, the line that keeps being true: the headlines told you what was falling. The money told you what was being bought. This week, for once, those were almost opposite stories — and the quiet one was the better one.
Good luck out there this week. Wishing you clear opportunities, the patience to look past the loudest furus on FinTwit, and the discipline to watch what smart money does instead.
Thank you for being part of this community and for investing your time in this week’s edition. The quality of this readership — thoughtful, disciplined, engaged — is what makes this work meaningful. I’m grateful to build alongside you. Here’s to a week of clarity, conviction, and well-executed opportunities.
— VolumeLeaders